Ecological remote sensing and application
As the increasing pressure caused by climatic changes and human activities, the structure and function of terrestrial ecosystems are undergoing dramatic changes. Understanding how ecosystem processes change at large spatial-temporal scales is crucial for dealing with the threats and challenges posed by global climate change. Traditional field survey method can obtain accurate plot-level ecosystem observations, but it is difficult to be used to address large-scale ecosystem patterns and processes because of spatial and temporal discontinuities. Compared to traditional field survey methods, remote sensing has the advantages of real-time acquisition, repeated monitoring and multi spatial-temporal scales, which can compensate for the shortcomings of traditional field observation methods. Remote sensing can be used to identify the type and characteristic of ground objects, and extract key ecosystem parameters, energy flow and material circulation through retrieving the information contained by electromagnetic signals. Remote sensing data have become an indispensable data source in ecological studies, especially at the ecosystem, landscape, regional or global scales. With the emergence of new remote sensing sensors (e.g., light detection and ranging, and solar-induced chlorophyll fluorescence) and near-surface remote sensing platforms (e.g., unmanned aerial vehicle and backpack), remote sensing is entering the three-dimensional era and the observation platform become more diverse. These three-dimensional, multi-source and time-series remote sensing data bring new opportunities to fully understand ecosystem processes across different spatial scales. This paper reviews the advances of the application of remote sensing in terrestrial ecosystem studies. Specifically, this study focuses on the derivation of biological factors from remote sensing data, including vegetation types, structures, functions and biodiversity of terrestrial ecosystems. We also summarize the current status of the remote sensing technology in ecosystem studies and suggest the future opportunities of ecosystem monitoring in China.
Aims Shrub-encroached grassland has become an important vegetation type in China’s arid and semi-arid region. Our study objective is to explore the spectral features of shrub and grass communities, as well as their empirical relationships with shrub coverage. The quantitative estimation of shrub cover based on medium-resolution Landsat satellite imagery provides the practical basis for long term retrieval of large areas of shrub expansion in the grassland region. Methods Linear models and Multiple Endmember Spectral Analysis Model (MESMA) based on medium resolution Landsat satellite imagery were developed to quantify the shrub coverage in a shrub-encroached grassland region in Xianghuang Banner, Nei Mongol using the spectral features and their seasonal differences between the shrub and grass communities. Important findings Compared to Leymus chinensis and Stipa krylovii dominated grass communities, Caragana microphylla community had a higher normalized difference vegetation index (NDVI), modified red edge normalized difference vegetation index (mNDVI705), and red edge slope. The red edge position of C. microphylla community shifted to longer wavelengths. The average and the maximum shrub coverage was 13% and 25%, respectively, in the shrub-encroached grassland based on both models. The correlation coefficient of determination (R2) and root mean square error (RMSE) of the linear model was 0.31 and 0.05, respectively. We found that the linear model based on seasonal differences of shrub and grass community was more suitable for retrieving shrub coverage in the study area from medium resolution imagery than the MESMA model that is based on mid-summer images.
Spectral reflectance is a new, real time and non-destructive hyperspectral remote sensing application to monitor plant water status and physiological changes. The spectral reflectance responses induced by water stress reflect the interaction and coupling of carbon, nitrogen and water cycles. A majority of previous studies focused on a specific structural or physiological effect on spectral reflectance with little attention on their interactions. This paper reviewed and synthesized the direct and indirect spectral responses caused by changes in plant water content, pigments, nutrient status, photosynthesis and chlorophyll fluorescence indices and their internal association. This paper also discussed the common approaches and the new techniques in applying spectral reflectance for detecting water status and physiological activities in plants. This paper concluded that analysis of the spectral reflectance at multiple temporal or spatial scales might have a potential application in projecting vegetation productivities, particularly in the context of climate change.
Aims Light-use efficiency (LUE) is one of critical parameters in the terrestrial ecosystem production studies. Accurate determination of LUE is very important for LUE models to simulate gross primary productivity (GPP) at regional and global scales. We used eddy covariance technique measurement and tower-based, multi-angular spectro-radiometer observations in autumn 2012 to explore the relationship between bidirectional reflectance distribution function (BRDF) corrected photochemical reflectance index (PRI) and LUE in different phenology and environment conditions in urban green-land ecosystems. Methods Using the eddy covariance technique, we estimated the temporal changes in GPP during the autumn 2012 over Beijing Olympic Forest Park. LUE was calculated as the ratio of GPP to the difference between incoming photosynthetically active radiation (PAR) and PAR reflected from the canopy. Daily PRI values were averaged from the BRDF using semi-empirical kernel driven models. The absolute greenness index (2G_RB) was made by webcam at a constant view zenith and view azimuth angle at solar noon. The logistic function was used to fit the time series of the greenness index. The onset of phonological stages was defined as the point when the curvature reached its maximum value. Important findings Webcamera-observed greenness index (2G_RB) showed a decreasing trend. There was a highly significant relationship between 2G_RB and air temperature (R2 = 0.60, p < 0.001). This demonstrates that air temperature is the main driving factor to determine the phenology. PRI estimated from multi-angle hyper-spectrum can estimate LUE in urban green-land ecosystems in vigorous photosynthetic period. The correlation was the strongest (R2 = 0.70, p < 0.001) in the peak photosynthetic period. PRI relates better to LUE under high temperature (>15 °C) with high vapour pressure deficit (VPD) (>700 Pa) and high PAR (>300 μmol·m-2·s-1). The LUE was up-scaled to landscape/regional scales based on these relationships and phenology. It can also be used for the estimation of GPP of urban green-land with high accuracy.
Aims Linear models have been widely used to examine the impacts of climatic factors on plant phenology, although the relationship between phenology and climate could be nonlinear. Based on survival analysis, robust nonlinear models were empirically developed to examine the phenological changes in relation to air temperature and precipitation for the grasslands in China and individual woody plants in Europe.
Methods Three datasets were used in our survival analysis: two datasets of the remotely-sensed vegetation phenology for grasslands in Nei Mongol grasslands and meadows in Qinghai-Xizang Plateau, and a dataset of the phenological observations of individual woody plants in Europe. Monte Carlo simulations were performed to estimate model parameters in our survival analysis.
Important findings The survival analysis appeared to be a powerful tool in modeling the nonlinear changes in green-up date (GUD) to the climatic factors. The analyses showed that both spring temperature and precipitation are significantly correlated with the GUD in the semi-arid grasslands in Nei Mongol. For Qinghai-Xizang Plateau and Europe, the spring temperature seemed highly correlated with GUD, while the correlation was weak with the higher Holdridge aridity index. The survival model predicted that the GUD in the three regions would be advanced by 1-6 days with an increase in temperature of 1 °C. A combined increase in spring temperature and precipitation would lead to nonlinear responses, suggesting the need for developing nonlinear models. Our empirical exercise in this study demonstrated that the survival analysis could offer an alternative tool for predicting plant phenology under the changing climate.
Aims Screening of spectral characteristic variables is one of the important means for aquatic plant recognition, and it is widely applied in aquatic plant species identification. In this paper, a method for identifying aquatic plants species was constructed by combining extracted spectral feature information with the multi-temporal Landsat 8 OLI image data analysis.
Methods In analyzing reflectance spectra of aquatic plants, the method of continuum removal for mineral analysis was introduced. The spectral resampling was performed on the measured spectral curve, and the spectral absorption depth was characterized by the continuous removal of the spectral resampling results. One-way ANOVA method was used to compare the seven spectral resampling bands and the three continuum removal absorption depth sensitive bands. Then the characteristic bands with significant differentiation of different aquatic plants were selected. The continuum removal was applied on remote sensing image processing. The results of the spectroscopic analysis were used to guide the identification of aquatic plants in using Landsat 8 OLI. The classification of aquatic plants was carried out by using support vector machine (SVM) classification.
Important findings The results of the measured spectrum resampling are similar to the atmospheric calibration of Landsat 8 OLI in the same position, and the results of the measured spectral curves can be used to guide the classification of Landsat 8 OLI. The one-way ANOVA method was used to compare seven spectral resampling bands and three continuous systems in absorbing sensitive wavelengths. The results showed that the short wave infrared 1 band, which was processed by continuum removal (SWIR1CR), was the best in distinguishing different types of aquatic plants. In this paper, the continuum removal was applied on remote sensing image processing, and it was found that the SWIR1CR band can better distinguish the submerged plants and the emergent plants. The normalized differential vegetation index and SWIR1CR band were well capable of identifying submerged plants, floating plants and emergent plants. Based on the SVM classification method, the classification accuracies of aquatic plants were 86.33%. The distribution of aquatic plants showed that the aquatic plants were mainly distributed in shallow water areas of the south north bank of Guanting reservoir. When the aquatic plant distribution area reached the peak, it accounted for about 35.13% of the total area of the reservoir. The growth distribution of submerged plants changed significantly during a year. The stem and leaves of submerged plants began to emerge in early June. Aquatic plants began to wither in October, and aquatic plants accounted for only 20% of the total area in November.
Aims Dissolved organic matter (DOM) is the most active component of organic matters in soils, and plays an important role in carbon cycles. It is a mixed organic compound with varying molecular sizes and weights. We aimed to explore the impacts of Dicranopteris dichotoma coverage on quantity and structure of DOM after vegetation restoration in severely eroded red soil region. Methods A typical sequence of vegetation restoration (Y0, without ecological restoration; Y13, ecological restoration for 13 years; Y31, ecological restoration for 31 years) was selected as the research object in Hetian Town, Changting County, Fujian Province, China. At each experimental site, soils were subject to three treatments—NRd, not removed D. dichotoma; Rd, removed D. dichotoma; and CK, control, and the effects of D. dichotoma on the spectral characteristics of DOM were evaluated.Important findings The results indicated that the quantity of soil DOC under NRd treatment of the Y0, Y13 and Y31 was 7.61, 4.83, and 5.47 times higher than their CK treatment, respectively. The Rd treatment had significantly lower DOC than that under NRd treatments, and it was 1.84, 4.12, and 4.73 times higher than their CK treatments, respectively. Thus the D. dichotoma had exerted significant effects on the quantity of soil DOM. The Aromaticity index (AI), emission fluorescence spectrum humification index (HIXem) and synchronous fluorescence spectrum humification index (HIXsyn) of DOM under the NRd treatment were significantly higher than those of the CK treatments in Y13 and Y31, respectively. However, the ratio of ultraviolet-visible light absorption photometric quantity at 250 nm wavelength to ultraviolet-visible light absorption photometric quantity at 365 nm wavelength (E2:E3) had an opposite trend. It showed that the DOM structure in soils covered by D. dichotoma contained more aromatic nucleus and had higher aromaticity and humification, and DOM molecular was larger. In addition, the AI and humification index (HIX) of DOM under the Rd treatment was significantly decreased compared with the NRd treatment. Similar results were observed by analysis of emission and synchronous fluorescence spectrum, and by the Fourier infrared transmission spectrum analysis. These results suggest that D. dichotoma had positive impacts on the complexity of DOM structure, but it was a long and slow process. The DOM spectral analysis showed that the soil DOM covered by D. dichotoma had a stable and complex structure and was easily adsorbed by soil colloid. As a result, Dicranopteris dichotoma had a positive effect on the accumulation of soil organic carbon.
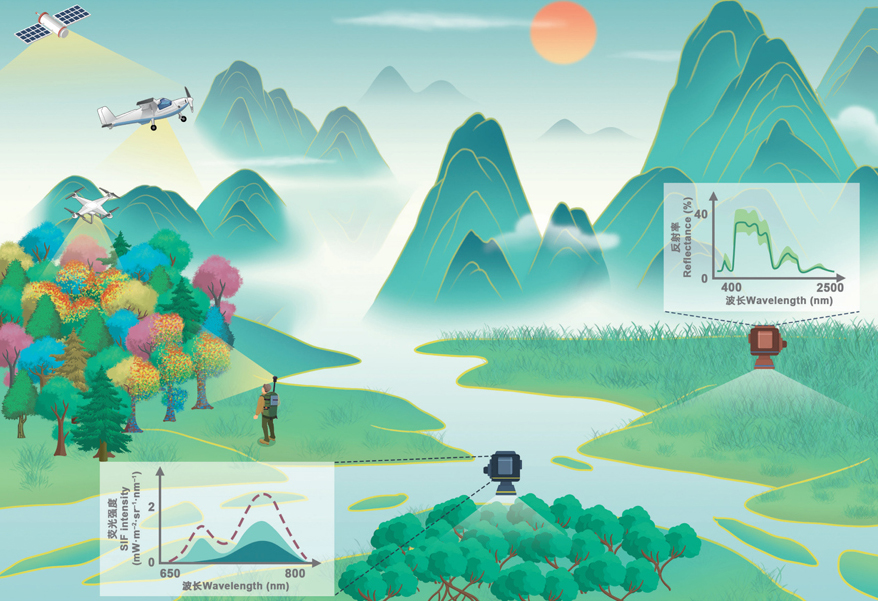
Recent advances in solar-induced chlorophyll fluorescence (SIF), which is a complement to optical remote sensing based on greenness observation, have made it possible to monitor the photosynthesis of plants in terrestrial ecosystems using state-of-the-art technologies. With the rapid development of tower-based, unmanned aerial vehicle (UAV), airborne and space-borne SIF observation technology and improving understanding of SIF mechanism, SIF is providing essential data support and mechanism understanding for the estimation of biological traits and gross primary production of terrestrial ecosystem, early detection of abiotic stress, extraction of photosynthetic phenology and monitoring of transpiration. In this review, we first introduce the fundamental theory, the observation systems and technologies and the retrieval method of SIF. Then, we review the applications of SIF in terrestrial ecosystem monitoring. Finally, we propose a roadmap of activities to facilitate future directions and discuss critical emerging applications of SIF in terrestrial ecosystem monitoring that can benefit from cross-disciplinary expertise.
Aims Estimation of gross primary productivity (GPP) of vegetation at the global and regional scales is important for understanding the carbon cycle of terrestrial ecosystems. Due to the heterogeneous nature of land surface, measurements at the site level cannot be directly up-scaled to the regional scale. Remote sensing has been widely used as a tool for up-saling GPP by integrating the land surface observations with spatial vegetation patterns. Although there have been many models based on light use efficiency and remote sensing data for simulating terrestrial ecosystem GPP, those models depend much on meteorological data; use of different sources of meteorological datasets often results in divergent outputs, leading to uncertainties in the simulation results. In this study, we examines the feasibility of using two GPP models driven by remote sensing data for estimating regional GPP across different vegetation types. Methods Two GPP models were tested in this study, including the Temperature and Greenness Model (TG) and the Vegetation Index Model (VI), based on remote sensing data and flux data from the China flux network (ChinaFLUX) for different vegatation types for the period 2003-2005. The study sites consist of eight ecological stations located in Xilingol (grassland), Changbaishan (mixed broadleaf-conifer forest), Haibei (shrubland), Yucheng (cropland), Damxung (alpine meadow), Qianyanzhou (evergreen needle-leaved forest), Dinghushan (evergreen broad-leaved forest), and Xishuangbanna (evergreen broad-leaved forest), respectively. Important findings All the remote sensing parameters employed by the TG and VI models had good relationships with the observed GPP, with the values of coefficient of determination, R2, exceeding 0.67 for majority of the study sites. However, the root mean square errors (RMSEs) varied greatly among the study sites: the RMSE of TG ranged from 0.29 to 6.40 g·m-2·d-1, and that of VI ranged from 0.31 to 7.09 g·m-2·d-1, respectively. The photosynthetic conversion coefficients m and a can be up-scaled to a regional scale based on their relationships with the annual average nighttime land surface temperature (LST), with 79% variations in m and 58% of variations in a being explainable in the up-scaling. The correlations between the simulated outputs of both TG and VI and the measured values were mostly high, with the values of correlation coefficient, r, ranging from 0.06 in the TG model and 0.13 in the VI model at the Xishuangbanna site, to 0.94 in the TG model and 0.89 in the VI model at the Haibei site. In general, the TG model performed better than the VI model, especially at sites with high elevation and that are mainly limited by temperature. Both models had potential to be applied at a regional scale in China.
Aims Monitoring and quantifying the biomass and its distribution in urban trees and forests are crucial to understanding the role of vegetation in an urban environment. In this paper, an estimation method for biomass of urban forests was developed for the Shanghai metropolis, China, based on spatial analysis and a wide variety of data from field inventory and remote sensing.Methods An optimal regression model between forest biomass and auxiliary variables was established by stepwise regression analysis. The residual value of regression model was computed for each of the sites sampled and interpolated by Inverse-distance weighting (IDW) to predict residual errors of other sites not subjected to sampling. Forest biomass in the study area was estimated by combining the regression model based on remote sensing image data and residual errors of spatial distribution map. According to the distribution of plantations and management practices, a total of 93 sample plots were established between June 2011 and June 2012 in the Shanghai metropolis. To determine a suitable model, several spectral vegetation indices relating to forest biomass and structure such as normalized difference vegetation index (NDVI), ratio vegetation index (RVI), difference vegetation index (DVI), soil-adjusted vegetation index (SAVI), and modified soil-adjusted vegetation index (MSAVI), and new images synthesized through band combinations such as the sum of TM2, TM3 and TM4 (denoted Band 234), and the sum of TM3, TM4 and TM5 (denoted Band 345) were used as alternative auxiliary parameters .Important findings The biomass density in urban forests of the Shanghai metropolis varied from 15 to 120 t·hm-2. The higher densities of forest biomass concentrated mostly in the urban areas, e.g. in districts of Jing’an and Huangpu, mostly ranging from 35 to 70 t·hm-2. Suburban localities such as the districts of Jiading and Qingpu had lower biomass densities at around 15 to 50 t·hm-2. The biomass density of Cinnamomum camphora trees across the Shanghai metropolis varied between 20 and 110 t·hm-2. The spatial biomass distribution of urban forests displayed a tendency of higher densities in northeastern areas and lower densities in southwestern areas. The total biomass was 3.57 million tons (Tg) for urban forests and 1.33 Tg for C. camphora trees. The overall forest biomass was also found to be distributed mostly in the suburban areas with a fraction of 93.9%, whereas the urban areas shared a fraction of only 6.1%. In terms of the areas, the suburban and urban forests accounted for 95.44% and 4.56%, respectively, of the total areas in the Shanghai metropolis. Among all the administrative districts, the Chongming county and the new district of Pudong had the highest and the second highest biomass, accounting for 20.1% and 19.18% of the total forest biomass, respectively. In contrast, the Jing’an district accounted for only 0.11% of the total forest biomass. The root-mean-square error (RMSE), mean absolute error (MAE) and mean relative error (MRE) of the model for estimating urban forest biomass in this study were 8.39, 6.86 and 24.22%, respectively, decreasing by 57.69%, 55.43% and 64.00% compared to the original simple regression model and by 62.21%, 58.50%, 65.40% compared to the spatial analysis method. Our results indicated that a more efficient way to estimate urban forest biomass in the Shanghai metropolis might be achieved by combining spatial analysis with regression analysis. In fact, the estimated results based on the proposed model are also more comparable to the up-scaled forest inventory data at a city scale than the results obtained using regression analysis or spatial analysis alone.
Forests are crucial terrestrial ecosystems with wide distribution and substantial biomass, playing a vital role in the global carbon cycle. The estimation of aboveground biomass (AGB) in forests serves as a significant indicator of ecosystem productivity and is pivotal for studying material cycles and global climate change. Traditional methods for AGB estimation rely on individual tree-scale or forest stand-scale tree physical structural information measurements, which are often time-consuming and labor-intensive to obtain. Remote sensing technology offers a solution for comprehensively and multi-temporally obtaining forest structural information in large scale, making it indispensable for forest AGB estimation. Therefore, it is important to review and summarize recent advancements in remote sensing techniques for estimating forest AGB to promote their application and guide the development of related industries. This paper presents a comprehensive overview of the principles and methods used for estimating forest AGB using optical data, synthetic aperture radar (SAR) data, and light detection and ranging (LiDAR) data. It also analyzes the current status of synergistic estimation of forest AGB using multiple remote sensing data sources. The study highlights three key findings: (1) The use of novel remote sensing data, such as high-resolution satellite imagery and Global Ecosystem Dynamics Investigation LiDAR data, is expanding the boundaries of spatial and temporal resolutions, providing enhanced data sources for forest AGB research. (2) Synergistic approaches that combine multiple remote sensing data sources show promise in improving the accuracy of forest AGB estimation, but further optimization of related models is needed. (3) Machine learning, artificial intelligence, and deep learning techniques have been widely applied in forest AGB estimation, but continuous research on remote sensing mechanisms remains essential for innovation. Improvements in models and methodologies should revolve around a better understanding of these mechanisms.
Aims Biological soil crust (hereafter crust) affects normalized difference vegetation index (NDVI) values in arid desert ecosystems. This study aimed to demonstrate the feasibility of combining crust NDVI values with meteorological data to distinguish the crust successional stage at the regional scale. Meanwhile, the characteristics of crust NDVI could provide the basis for the error analysis of NDVI-based surface ecological parameters estimation in desert ecosystems. We also suggested the optimum periods for crust observation based on the multi-temporal remote sensing images.Methods NDVI values of five types of dominant crusts, three typical sand-fixing shrubs and bare sand were collected by spectrometer in the field. Crusts and shrubs were randomly selected in revegetated areas established in 1956, 1964, and 1973 at Shapotou, which is on the southeastern edge of the Tengger Desert. We used the space-for-time method to study the characteristics of crust NDVI values and their responses to precipitation and temperature during the succession process of artificial sand-fixing vegetation. Additionally, we evaluated the contribution of crust NDVI values to the whole ecosystem NDVI values by comparing the NDVI values of crusts, shrubs and bare sand.Important findings 1) With succession process of the artificial sand-fixing vegetation, the crust NDVI values significantly increased. Among different crust types, we found the following order of NDVI values: Didymodon vinealis crust > Bryum argenteum crust > mixed crust > lichen crust > algae crust. 2) Crust NDVI values were significantly affected by precipitation, temperature and their interaction, and the influences showed significant seasonal differences. Furthermore, we found significantly linear correlations between crust NDVI value and precipitation, and between crust NDVI value and the shallow soil moisture content covered by crust. A significantly negative linear correlation between daily mean temperature and crust NDVI value, and a significantly exponential correlation between the surface temperature of crust and its NDVI value. With the succession process of artificial sand-fixing vegetation, the response of crust NDVI value to precipitation and temperature became more sensitive. In addition, the response of crust NDVI value to temperature was more sensitive in spring than in summer, while that to precipitation was less sensitive in spring than in summer. 3) Moss crust NDVI value was significantly higher than that of shrubs and bare sand after the rainfall event in spring, while shrubs NDVI value was significantly higher than that of crust after the rainfall event in summer. Considering the coverage weights of different ground features in sand-fixing areas, crust NDVI values contributed 90.01% and 82.53% in spring and summer, respectively, to the regional NDVI values, which were higher than those of shrubs (9.99% and 17.47% in spring and in summer, respectively). Additionally, with the succession process of artificial sand-fixing vegetation, crust NDVI values contributed more, while shrubs contributed less to regional NDVI values.
Aims Using leaf spectral reflectance to detect plant status in real time and non-destructively is a new method of forest drought assessment, but each spectral index possesses considerable moisture sensitivity. Therefore, determining moisture index applicable to tree leaf and its sensitive spectral index are both very important. Methods This study selected Quercus aliena var. acuteserrata leaves in different growth stages and canopy positions as the research object, and measured leaf moisture index and its synchronous reflectance spectral response curve during the dehydration process, explored the relationship between changes of leaf spectral reflectance and water status, compared and evaluated the advantages and disadvantages of correlation between the moisture indices of leaves in different growth stages and space positions and different spectral reflectance indices. Important findings Results indicated: (1) The variability of relative water content (RWC) and equivalent water thickness (EWT) in different growth stages and canopy positions was smaller than specific leaf water content (SWC) and leaf moisture percentage on fresh quality (LMP) as measured by the four different moisture indices. RWC and EWT could steadily characterize the holistic water status of trees, and they had greater spectral sensitivity. Therefore, they were suitable for application in remote sensing detection. (2) Spectral reflectance difference analysis and spectral reflectance sensitivity analysis showed that the leaf spectral sensitivity is strongly influenced by growth stage. In short wave infrared region, spectral reflectance of mature leaves changed slightly in the initial stage of dehydration stress, but new expended leaves showed obvious spectral differences during the dehydration process. (3) Through the correlation analysis between 15 different spectral indices and moisture indices, we found that water index (WI)-RWC and double difference index (DDn (1530,525))-EWT has higher correlation. The fitted relations of WI-RWC are greatly influenced by leaf growth stage and canopy position, while those of DDn(1530,525)- EWT are more stable.
Forest net primary production (NPP) is an important parameter on measuring the terrestrial carbon source/sink. More accurately estimating NPP of forest ecosystems is the focus of carbon cycle. Our objective was to explore how to use remote sensing process model to simulate NPP of the northeast forest more accurately, and what impacts of forest fire disturbance have on NPP.
In this study, based on remote sensing data and meteorological data, Boreal Ecosystem Productivity Simulator (BEPS) model was used to simulate NPP of the northeast forest in 2003; The result of BEPS model acted as the reference year data of Integrated Terrestrial Ecosystem C-budget (InTEC) model to simulate NPP from 1901 to 2008 of the northeast forest. Then forest fire disturbance data was incorporated in the InTEC model to simulate NPP from 1966 to 2008 of Daxing’an Mountain.
The average value of NPP of the northeast forest was only 278.8 g C·m-2·a-1 in 1901. In 1950, average NPP had reached to 338.5 g C·m-2·a-1. The average NPP of the northeast forest in 2008 was 378.4 g C·m-2·a-1; Substantial increase was evidenced for Daxing’an Mountain, Xiaoxing’an Mountain and Changbai Mountain with 200 g C·m-2·a-1 to 300 g C·m-2·a-1 increase for Changbai Mountain. The average and total value of NPP of Liaoning in 2008 was relatively low, but was still 70 percent higher than that in 1901. Moderate and large fires did not drastically reduce NPP, with less than 10 percent reduction during the year of fire occurrence. In the following years, NPP recovered quickly and maintained at a high level. NPP reduced substantially in each of the four years with burned area exceeding 100000 hm2 in Daxing’an Mountain.
Plant functional traits are the measurable characteristics that indicates plant adaptation to the environment, and understanding the patterns of certain characteristics, and their drivers is an essential component of plant ecology and earth system modeling research. Traditional field-based approaches for characterizing plant functional traits are time-consuming, labor-intensive and expensive, and usually focus on the traits of peak growing season and dominant species, making the scaling extension and spatiotemporal coverage of plant functional traits a great challenge. In contrast, newly emerging multi-scale hyperspectral remote sensing techniques potentially provide new avenues to easily identify and characterize functional traits. Here we first overview the principles and brief history of hyperspectral remote sensing technology for plant functional traits monitoring. Then, we detailed the principal methods for modelling the spectral-trait relationships, including empirical and semi-empirical statistical methods and inversion methods relying on physical-based modelling, among which the statistical partial least squares regression is widely used. We then used case studies to demonstrate the application while illustrating the remaining problems of plant functional traits monitoring using the hyperspectral remote sensing techniques respectively at leaf, community and landscape scales. Finally, we highlight four important future directions to advance hyperspectral remote sensing of plant functional traits, including: 1) exploring the generalizability and underlying mechanisms of spectral-trait modelling; 2) developing novel, transparent methodology that scales the spectral-trait relationships from leaf, canopy to satellite levels; 3) elucidating the pattern and drivers of remotely sensed plant functional traits and diversity across various spatiotemporal scales; and 4) investigating the linkage among environment, plant functional diversity, biodiversity and ecosystem functioning.
Aims This study was conducted to investigate carbon stocks in forest ecosystems of different stand ages in Anhui Province, and to identify the carbon sequestration potential of climax forests controlled by the natural environment conditions.Methods Data were collected based on field investigations and simulations were made with the BIOME4 carbon cycle model.Important findings Currently, the total forest carbon stocks in Anhui Province amounts to 714.5 Tg C: 402.1 Tg C in vegetation and 312.4 Tg C in soil. Generally, both the total and vegetation carbon density exhibit an increasing trend with the natural growth of forest stands. Soil carbon density increases from young to near mature forests, and then gradually decreases thereafter. Young and middle-aged forests account for 75% of the total forest area in Anhui Province, with potentially an additional 125.4 Tg C to be gained after the young and middle-aged forests reach near mature stage. Results of BIOME4 simulations show that potentially an additional 245.7 Tg C, including 153.7 Tg C in vegetation and 92 Tg C in soil, could be gained if the current forests are transformed into climax forest ecosystems in Anhui Province.
Aims Vegetation water content is an important biophysical property of terrestrial vegetation, and its remote estimation can be utilized for real-time monitoring of vegetation drought stress. This paper reviewed and summarized the conception and research progress of four commonly used vegetation water indicators: canopy water content, leaf equivalent water thickness, live fuel moisture content, and relative water content. The advantage and disadvantage of various research methods were evaluated by estimating vegetation water content and identifying the limitation in monitoring vegetation water content using optical hyperspectral remote sensing techniques. Finally, the future research tasks were discussed to address issues on accurate monitoring, early warning and evaluation of vegetation drought stress.
Estimating forest biomass at regional scale with high accuracy is among the pressing challenges in evaluating ecosystem functions and characteristics (e.g., carbon storage).
This study is based on airborne small-footprint discrete-return LiDAR data, Landsat 8 OLI multispectral data, and in situ measurements from 55 forest plots in Yushan, Changshu, Jiangsu Province. A total of 87 independent variables (53 from OLI metrics and 34 from LiDAR metrics) were used in the Pearson correlation analysis for estimating aboveground (WA) and belowground (WB) biomass by identifying the significant independent variables. Three independent models by using OLI, LiDAR and their combinations (i.e., the combo model) were established through stepwise regression analysis.
The correlation coefficients of determination (R2) for WA and WB models are greater than 0.4. The R2 seemed much higher when the estimations were type-specific (e.g., coniferous, broad-leaf and mixed forest), with R2 of >0.67. The Combo model by forest type yielded an R2 of 0.88 for WA and 0.92 for WB, while the OLI-based model had R2 of 0.73 and 0.81 for WA and WB, respectively. The LiDAR-based model has R2 of 0.86 and 0.83 for WA and WB, respectively.
Aims Ecological water conveyance is of great importance for desert riparian wetland ecosystem. However, few studies have been focused on the quantitative evaluation of water conveyance to wetland restoration due to a lack of continous observation data. This paper analyzed the temporal wetland area changes between Yengisu and Alagan in the lower reach of Tarim River based on time series remote sensing data during 2000-2018, and evaluated the effects of ecological water conveyance on wetland restoration, so as to guide the ecological water conveyance and maintain the stability of the desert wetland ecosystem. Methods About 354 Landsat ETM+/TM/OLI, Sentinel 2 images during 2000-2018 were used to map the monthly wetland area changes in the lower reach of Tarim River, then their annual, seasonal and spaital areal changes were analyzed. The correlation between wetland area changes and ecological water conveyance, underground water levels were also evaluated based on Pearson correlation and cross-correlation methods. Important findings The wetland area has steadly increased in the last 19 years. The areal change rate was minor before 2011 while rapidly increased after 2011. The wetland expanded at a high rate during 2011-2013 and 2017-2018. Different ecological water volumes and water conveyance patterns (single channel or dual channel) can explain different areal changing rates at different stages. The correlation analysis between wetland area changes and ecological water volumes showed that the accumulative ecological water volume is the primary reason causing wetland expansion in recent years. In order to maintain a steady improvement of wetland vegetation, more than 350 million square meters of ecological water are conveyed to the downstream of the Tarim River through dual channel. When the groundwater depth is maintained between -5.0- -3.5 m, the wetland vegetation can sustain a good growth condition.
Aims Accurate assessment of plant aboveground biomass is important for optimizing grassland resource management and for understanding the balance of carbon, water and energy fluxes in grassland ecosystems. This study constructed the optimal empirical models by near-surface remote sensing normalized difference vegetation index (NDVI) data, and then estimated plant aboveground biomass in an alpine grassland on the Qingzang Plateau.Methods Using the dataset of both the field-measured aboveground biomass and the NDVIRS observed by plant canopy spectrometer (RapidSCAN), we constructed the empirical models for estimating aboveground biomass in different phases of the growing season across 2018 and 2019. Using the NDVICam time series observed by phenology camera and the estimated models, we simulated seasonal dynamics of aboveground biomass in 2018.Important findings (1) The seasonal dynamics of NDVICam, NDVIRS and aboveground biomass exhibited a similar unimodal pattern; however, the timing of peak NDVI (August) preceded that of peak aboveground biomass (July). (2) The best model for estimating aboveground biomass is the power function in May, July and September, and the quadratic equation in June and August. The estimation accuracy ranged from 0.29 to 0.77. (3) The estimation of aboveground biomass based on the models in different phases of growing season (R2 = 0.91) showed a higher accuracy compared to that based on the model at a single time (September)(R2 = 0.49). Our results suggest that the near-surface remote sensing is an effective approach for estimating alpine grassland aboveground biomass, and further investigation on the seasonal growth of plants will help accurately evaluate grassland resources.
AimsRevealing the spatial pattern of riparian vegetation in hyper-arid regions can improve our understanding on the water relations of riparian vegetation in the desert watershed ecosystem, and also can provide valuable scientific guidance for desertification control and water resources management of watershed of the arid region in northwestern China. This research objective is to show the spatial distribution and structures of typical riparian vegetation in hyper-arid desert watershed from regional and overall perspective.Methods Based on Landsat-8 OLI remote sensing images and a large number of field vegetation surveys, the supervised classification method was used to distinguish three main vegetation categories in the lower Tarim River basin: Tamarix thicket, Populus euphratica woodland, and Phragmites australis grassland. The leaf area index (LAI) of Tamarix thickets and Populus euphratica woodlands were inverted by using the remote-sensed LAI inversion empirical model that we developed.Important findings Supervised classification supporting abundant information of ground objects by remote sensing was an effective method to determine desert riparian vegetation categories in arid desert regions. The area was 336.4 km2 for the Populus euphratica woodlands and 405.3 km2 for the Tamarix thickets, respectively. The Tamarix thickets had a wider distribution range while the Populus euphratica woodlands grew near the river channel. The overall LAI of the riparian vegetation was low. The average LAI value was 0.253 for the Tamarix thickets and 0.252 for the Populus euphratica woodlands. The areas of vegetation with the LAI value of less than 0.5 accounted for 92.4% and 90.1% of the total area of the Tamarix thickets and the Populus euphratica woodlands, respectively. The statistic results showed that large spatial variability of the riparian vegetation LAI existed. The spatial variability of the Populus euphratica woodlands was larger than that of the Tamarix thickets. The LAI values of the riparian vegetation had a significant negative exponential relationship with the distances away from the river channel. The LAI values declined rapidly within the distance of 1 km from the river channel and they were generally lower than 0.1 when the distances beyond 1 km, which indicated that the riparian vegetation was mainly distributed within 1 km from both side of the river. This research indicated three basic characteristics of the spatial pattern in riparian vegetation from hyper-arid desert regions, including overall sparse spatial distribution, high spatial variability and negative exponential relationship between LAI and distance away from the river channel.
Aims Forest canopy closure is one of the essential factors in forest survey, and plays an important role in forest ecosystem management. It is of great significance to study how to apply LiDAR (light detection and ranging) data efficiently in remote sensing estimation of forest canopy closure. LiDAR can be used to obtain data fast and accurately and therefore be used as training and validation data to estimate forest canopy closure in large spatial scale. It can compensate for the insufficiency (e.g. labor-intensive, time-consuming) of conventional ground survey, and provide foundations to forest inventory.Methods In this study, we estimated canopy closure of a temperate forest in Genhe forest of Da Hinggan Ling area, Nei Mongol, China, using LiDAR and LANDSAT ETM+ data. Firstly, we calculated the canopy closure from ALS (Airborne Laser Scanning) high density point cloud data. Then, the estimated canopy closure from ALS data was used as training and validation data to modeling and inversion from eight vegetation indices computed from LANDSAT ETM+ data. Three approaches, multi-variable stepwise regression (MSR), random forest (RF) and Cubist, were developed and tested to estimate canopy closure from these vegetation indices, respectively.Important findings The validation results showed that the Cubist model yielded the highest accuracy compared to the other two models (determination coefficient (R2) = 0.722, root mean square error (RMSE) = 0.126, relative root mean square error (rRMSE) = 0.209, estimation accuracy (EA) = 79.883%). The combination of LiDAR data and LANDSAT ETM+ showed great potential to accurately estimate the canopy closure of the temperate forest. However, the model prediction capability needs to be further improved in order to be applied in larger spatial scale. More independent variables from other remotely sensed datasets, e.g. topographic data, texture information from high-resolution imagery, should be added into the model. These variables can help to reduce the influence of optical image, vegetation indices, terrain and shadow and so on. Moreover, the accuracy of the LiDAR-derived canopy closure needs to be further validated in future studies.
Aims Using remote sensing data for tree species classification plays a key role in forestry resource monitoring, sustainable forest management and biodiversity research.Methods This study used integrated sensor LiCHy (LiDAR, CCD and Hyperspectral) to obtain both the high resolution imagery and the hyperspectral data at the same time for the natural secondary forest in south Jiangsu hilly region. The data were used to identify the crown and to classify tree species at multiple levels. Firstly, tree crowns were selected by segmenting high-resolution imagery at multiple scales based on edge detection; secondly, characteristic variables of hyperspectral images were extracted, then optimization variables were selected based on the theory of information entropy. Tree species and forest types were classified using either all characteristic variables or optimization variables only. Finally, tree species and forest types were reclassified along with the tree crowns information, and the accuracy of classification was discussed. Important findings Based on all available characteristic variables, the overall accuracy for four typical tree species classification was 64.6%, and the Kappa coefficient was 0.493. The overall accuracy for forest types classification was 81.1%, and the Kappa coefficient was 0.584. Based on optimization variables only, the overall accuracy for four typical tree species classification dropped to 62.9%, and the Kappa coefficient was 0.459. The overall accuracy for forest types classification was 77.7%, and the Kappa coefficient was 0.525. Obtaining both high resolution image and hyperspectral data at the same time by integrated sensor can increase overall accuracy in classifying forest types and tree species in northern subtropical forest.
AimsAlpine desert, as the top part of the vertical vegetation spectrum of the Qinghai-Xizang Plateau, is widely distributed in the high altitude zones in the Qilian Mountains (QLM). Its distribution and growth conditions are different from the surrounding area. It is more sensitive to climate change but rarely being studied. In this study, we focused on the dynamic changes and spatiotemporal differences of the alpine desert belt in the QLM under the warming climates from the 1990s to the 2010s.MethodsThe distribution changes in the alpine desert belt in the QLM during the past three decades were obtained from the thematic mapper and the operational land imager remote sensing digital images by using the decision tree classification and artificial visual interpretation. Spatiotemporal differences of the alpine desert distribution were studied by the overlay analysis. Meanwhile, the relationships between the changes and climates were explored using correlation analysis. Important findings The results indicated that the alpine desert shrank gradually and lost its area by approximately 348.3 km2·a-1 in the QLM with climate warming in the past 30 years. The amplitude of the shrinkage increased from east to west. However, its areas expanded in some sections. Collectively, the low boundary of the alpine desert belt moved upwards to higher altitudes at a velocity of 15 m per decade. The maximum upward-shifting amplitude lied in the western QLM, followed by the eastern and middle QLM. The vertical zonal shifting was modulated by topography-induced difference in local hydrothermal conditions. The distribution shifts in the alpine desert belt were mainly concentrated in the gentle slope regions. Because of the differences of hydrothermal background, the position shifts were greater in the sunny aspects than in the shady aspects in the eastern and middle QLM, while opposite in the western QLM. The differences in the hydrothermal conditions and regional topography led to the spatiotemporal change differences of the alpine desert distribution. The correlation between the normalized differential vegetation index and climate factors in the transition zone showed that temperature was the main factor affecting the dynamics and spatial differences of the alpine desert belt in the QLM, and climate warming facilitated the alpine meadow below the alpine desert belt by releasing the low temperature limitation on the vegetation growth.
Aims The distribution pattern of green vegetation in urban streets has significant impacts on urban ecological environment and physical/mental health of local residents. Accurate detecting and monitoring of street green information is of great significance for precise urban planning and management, while there are few studies focusing on urban greenery estimation using profile image system. Methods In this study, combining network information capturing and geospatial information analysis technology, Taiʼan city was selected as the case study area. Based on the Baidu application programming interface (API), a total of 3 276 Baidu Street View (BSV) images of 273 research samples were obtained and processed, and the green vegetation pixels in the image were extracted by computer supervised classification and compared with the artificial extraction results. Based on the proposed Baidu Street Vegetation Distribution Index (BSVDI), we monitored the street vegetation’s distribution characteristics from the pedestrian perspective, and analyzed the street- scale vegetation distribution pattern. Important findings The BSV image could be used as the main data source to monitor the distribution of green trees and lawns in pedestrian’s perspective on the street scale. BSVDI was higher in the center, northeast and southeast of the study area than the other regions. BSVDI and remote sensing extracted vegetation covered area are significantly and positively correlated, with correlation coefficient of 0.76, 0.63 and 0.49 in the buffered distance of 10, 20 and 50 m, respectively. However, the change trends of the BSVDI and remote sensing results were not completely consistent in each study site. This study implies that the combination of BSVDI and remote sensing monitoring results can better guide urban green landscape planning and precise management.
Aims Water use efficiency (WUE) is a key index to measure the coupling degree of carbon and water cycle in ecosystems. The WUE of vegetation in Tianshan Mountains in Xinjiang and the north and south sites of the main oasis was estimated and then the spatio-temporal distribution of vegetation WUE was analyzed to explore its influencing factors, which will be of great significance to the protection of ecosystem and the rational utilization and development of agricultural water resources in this region. Methods This study used data from moderate-resolution imaging spectroradiometer (MODIS), meteorological and land use type data to estimate the vegetation WUE. The spatio-temporal characteristics of vegetation WUE were analyzed in Tianshan Mountains in Xinjiang over the last 18 years, and the relationship of WUE with climatic factors was evaluated. Important findings The results indicated that: (1) From 2000 to 2017, the average annual vegetation WUE for Tianshan Mountains in Xinjiang was 1.11 g·mm -1·m -2, ranging from 0.84 to 1.34 g·mm -1·m -2. As a whole, the annual decrease trend of vegetation WUE was 0.014 1 g·mm -1·m -2·a -1, and vegetation WUE showed a strong vertical zonality in Tianshan Mountains in Xinjiang, as indicated by the decrease with the altitude above 1 000 m. (2) The vegetation WUE in Tianshan Mountains in Xinjiang showed a unimodal change pattern with significant seasonal difference, in order of summer > spring > autumn > winter. (3) Correlation analysis and statistical results indicated that the dynamic change of vegetation WUE in Tianshan Mountains in Xinjiang was closely related to temperature and rainfall. The regions with vegetation WUE changes resulting from non-climate factors accounted for 39.26% in Tianshan Mountains in Xinjiang. However, the factors of temperature and precipitation contributed to the change of vegetation WUE as 33.23% and 8.57%, respectively. On the other hand, the combination of temperature and precipitation with heavy impact and light impact contributed to WUE by 5.63% and 13.13%, respectively. Overall, temperature played the most important role among all climate factors in the changes in vegetation WUE. (4) The WUE of paddy field and dryland decreased continuously with time, and these areas were mainly affected by non-climatic factors, suggesting the irrationality in local human activities.
Solar radiation is fundamental to the maintenance and development of forest ecosystem functions and services. Therefore, modeling the radiation transfer process in forest is of great significance for understanding forest ecosystem processes. In recent years, the rapid development of three-dimensional radiative transfer models makes it possible to accurately simulate the distribution and dynamics of radiation within forest canopies. In order to better understand three-dimensional radiative transfer models and make them better serve forest ecosystem research, we review the principles, applications and future prospects of these models. Firstly, common principles of three-dimensional radiative transfer models such as radiosity and ray tracing are briefly introduced, and then the applications of three-dimensional radiative transfer models in forest ecosystem research are summarized. Finally, future opportunities of integrating multiple datasets and models to better facilitate forest ecosystem research, such as model coupling and making various models easier to use, are discussed. With the accumulation of ecological big data and improvement of ecosystem progress models, three-dimensional radiative transfer models will play a more important role in theoretical research and practices of forest ecology in the future.
Aims Monitoring forest species diversity continuously and efficiently is important to maintain ecosystem services and achieve sustainability and conservation goals. In this paper, we explored the relationship between leaf biochemical and spectral properties and their inner linkage with species diversity, then estimated the forest species diversity based on a clustering algorithm using airborne imaging spectroscopy and Light Detection and Ranging (LiDAR) data in the Gutianshan National Nature Reserve of China. Methods Firstly, we isolated individual tree crowns (ITCs) with the watershed algorithm from the LiDAR data. Then we calculated the optimal vegetation indices (VIs) representing the key biochemical properties from the hyperspectral data and selected optimal structural parameters from commonly used LiDAR-derived structural parameters based on correlation and stepwise regression analysis with the field samples. Finally, a self-adaptive Fuzzy C-Means (FCM) clustering algorithm was applied to map the species diversity (i.e. Richness, Shannon-Wiener index and Simpson index) in the study area for each 20 m × 20 m moving window. Important findings The results indicated that biochemical components (chlorophyll a & b, total carotenoids, equivalent water thickness, specific leaf area, cellulose, lignin, nitrogen, phosphorus and carbon) could be well quantified by leaf spectrum using partial least squares regression (R2 = 0.60-0.79, p < 0.01), and represented by hyperspectral VIs, namely, Transformed Chlorophyll Ratio Index/Optimization of Soil-adjusted Vegetation Index (TCARI/OSAVI), Carotenoid Reflectance Index (CRI), Water Band Index (WBI), Ratio Vegetation Index (RVI), Photochemical Reflectance Index (PRI) and Canopy Chlorophyll Concentration Index (CCCI). The individual tree isolation showed high accuracy (R 2 = 0.77, RMSE = 16.48). The correlation and stepwise regression analysis showed tree height and skewness were the optimal structural parameters among seven commonly used forest structural parameters (R 2 = 0.32, p < 0.01). The species diversity indices calculated from the self-adaptive FCM clustering algorithm based on the six VIs and two optimal structural parameters correlated well with the field measurements (species richness, R 2 = 0.56, RMSE = 1.81; Shannon-Wiener index, R 2 = 0.83, RMSE = 0.22; Simpson index, R 2 = 0.85, RMSE = 0.09). With the clustering method combined with crown-by-crown variations in hyperspectral biochemical VIs and LiDAR-derived structural parameters, we created continuous maps of forest species diversity in the examined subtropical forest without the need to identify specific tree species. Our case study in Gutianshan showed the potential of airborne hyperspectral and LiDAR data in mapping species diversity of the subtropical evergreen broad-leaved forest. It could also provide a pathway for monitoring the state and changes of forest biodiversity at regional scales.
Aims Plant diversity monitoring is the basis of biodiversity assessment and developing conservation policy. Traditional forest plant diversity monitoring is mainly based on field surveys, which is difficult to quickly obtain the spatial distribution and dynamic change of forest plant diversity. The development of remote sensing technology provides an important tool for assessing forest plant diversity at the regional scale. In this study, we explored two methods of forest plant diversity estimation based on Sentinel-2A satellite images and field data in three selected national nature reserves (Liangshui, Fenglin, and Hunchun).
Methods We used two methods to estimate forest plant diversity: (1) Direct estimation based on spectral diversity at the pixel and cluster scales, respectively; (2) Indirect estimation based on random forest regression. The spectral diversity was calculated based on the coefficient of variation and convex hull area at the pixel scale, respectively. K-means clustering method was used for cluster analysis to calculate the spectral diversity between clusters. For the indirect estimation, we used 10-fold cross validation to select characteristic variables for later diversity calculation.
Important findings Our results showed that: (1) At the pixel scale, the estimation accuracy of Shannon-Wiener diversity index based on convex hull area (R2= 0.74) was better than that of coefficient of variation (R2= 0.60); (2) The pixel-based estimation accuracy of Shannon-Wiener diversity index outperformed clustering basis (R2= 0.59); (3) Based on six feature variables, the Shannon-Wiener diversity index was best estimated using the random forest regression algorithm (R2= 0.79); (4) Both the Simpson diversity index and species richness could not be accurately estimated by the above methods. Our findings indicate the capability of Sentinel-2A satellite images to estimate the Shannon-Wiener diversity index, providing reference and basis for forest plant diversity estimation at a large scale.
Aims Vegetation phenology is an important indicator to reflect the stages of vegetation growth, which is of great significance to the feedback to climate. Solar-induced chlorophyll fluorescence (SIF) is a by-product of photosynthesis, which provides the possibility to directly detect vegetation phenology at the global scale. In order to reveal the accuracy of phenology estimated by SIF of different forest types, we estimated phenology of three forest types in the Northern Hemisphere.
Methods Based on 35 eddy flux tower sites in the Northern Hemisphere during the period of 2007-2014, we estimated phenology of three typical forest types using SIF value and gross primary production (GPP) by double logistic growth model and dynamic threshold. Correlation analysis was used to evaluate the different potential of SIF in estimating phenology of different forest types.
Important findings Results showed that: 1) SIF was more suitable to estimate the timing of the start of growing season (SOS) than the timing of the end of growing season (EOS). 2) SOS based on SIF had the highest correlation with SOS based on GPP in mixed forests (MF). However, the SOS of deciduous broadleaf forest (DBF) and evergreen needleleaf forest (ENF) could not be accurately tracked by SIF value. 3) The preseason shortwave radiation (SR) was the primarily environmental factor of SOS.
Aims Since the dynamic distribution of aquatic plants can reflect the variation of water ecological environment, it is of great significance to fully understand the spatial and temporal distribution characteristics of aquatic plants for better lake management and monitoring.
Methods On the basis of Landsat image data, this study calculated three vegetation indices, including normalized difference water index (NDWI), green veg index (Green), and macroalgae index (MAI), and constructed an aquatic plant extraction for the Donghu Lake of Wuhan using the decision tree classification method. With this method, we mapped the seasonal distribution of emergent/floating and submerged plants in the Donghu Lake in 2020, as well as their inter-annual variations during a 31-year period from 1990 to 2020.
Important findings Our results showed that the decision tree model is capable of determining the distribution of aquatic plants in the Donghu Lake accurately, with an overall accuracy of 82.29% and Kappa coefficient of 72.39%. The analysis of the seasonal variation of aquatic plants in the Donghu Lake reveal that the area of aquatic plants first increased and then decreased. In spite of being limited in February, the distribution area gradually expanded from April to August, and subsequently declined after October. The distribution and area of aquatic plants varies greatly, which can be divided into three stages regarding the long-term analysis. In the first stage (1990-1996), the area of emergent/floating plants decreased first and then increased, while that of submerged plants presented an increasing trend on a continued basis. In the second stage (1997-2015), the area of submerged plants and emergent/floating plants exhibited significant fluctuations from year to year. During this period, the area of aquatic plants reached a maximum of 2.61 km2, whereas the minimum of 0.49 km2. In the third stage (2016-2020), the aquatic plants in the Donghu Lake gradually recovered, leading to a 30% increase in the area of emergent/floating plants and a 18% increase in the area of submerged plants. Upon a study of the relationship between the area of aquatic plants, annual average temperature, and annual precipitation over the recent three decades, a conclusion can be drawn that annual average temperature and annual precipitation had little influence on the area of aquatic plants in the Donghu Lake. Instead, we found that environmental indicators, such as total phosphorus content, total nitrogen content, water depth, transparency, and turbidity, have significant spatial differences in the Donghu Lake, which are likely to affect the distribution of aquatic plants.
Phenology model is considered as the most efficient tool to assess the phonological responses of plants to future climate change. Furthermore, as an important component in dynamic ecological models, the performance of phenology model is of significance for the precision in simulating mass and energy exchanges between land and atmosphere. Combining long time series remote sensing data and climate data to construct regional phenology model may be the only way to solve the problem of deficiency in lacking in-situ observational data on phenology and species-specific phenology models. The objective of this study was to develop a new method of sample selections for constructing phenology in the arid zone of Central Asia where only sparse observational data are available.
Based the phenology data retrieved from 250 m-resolution MODIS images for the period 2000-2010, a new method is developed for constructing the vegetation phenology model in arid zone. A set of rules were built to select the representative pixels of PFTs (plant function types) surrounding the climate station, making sure that the climate of the representative pixels of PFTs could be represented by the observed meteorological data at the station, and then the phenology data on the representative pixels of PFTs were extracted from the MODIS images and the corresponding climatic data were set as the sample for model fitting and assessment. Forty-six representative pixels of PFTs for desert grassland vegetation and broadleaved deciduous forests were selected under the rules. The phenology model parameters were estimated using data from odd-numbered years and the simulation accuracy was assessed with the independent even-year data. Particle swarm optimization algorithm was used to parameterize the pre-selected model. The root-mean-square error and coefficient of determination were used to examine the performance of model with independent data.
The best model for desert steppe vegetation was the modified temperature-precipitation model and the best model for deciduous broadleaved forest was the alternative model. Compared with other documented findings, the new method was proven feasible, and the results also suggested that this new method may improve the spatial match of climatic data and vegetation phenology data, and therefore contribute to improvement of the phenology model accuracy.
Aims Accurately obtaining forest structural attributes is important for forest ecosystem research and protection. As a key data source, satellite remote sensing data are used to derive various regional and global products of forest structure and conditions, which are widely used in forest condition evaluation, forest biomass estimation, and forest disturbance and biodiversity monitoring. However, these products derived from satellite remote sensing data lack verification for Chinaʼs forested areas, and their accuracy and uncertainty under different forest structure and terrain conditions is not clear. Light detection and ranging (LiDAR) has the advantage of acquiring high-precision three-dimensional information. It has been widely used in monitoring forest ecosystems and validating various datasets of forest structure derived from remote sensing data. This study focused on evaluating the accuracy of Global Land Surface Satellite Products System-Leaf Area Index (GLASS LAI), Global Land Cover Facility-Tree Canopy Cover (GLCF TCC), and Global Forest Canopy Height (GFCH) products in China based on massive unmanned aerial vehicle (UAV) LiDAR data.
Methods We collected nationwide LiDAR point cloud data at 114 sites in China’s forested areas to build the benchmark validation dataset including canopy cover, canopy height and LAI. The corresponding pixel values of the above three products were extracted using the geolocation from UAV LiDAR data. The coefficient of determination (R2) and root mean square error (RMSE) were used to evaluate the accuracy and uncertainty of the three products. The uncertainty under different forest types, canopy cover and terrain conditions were also analyzed.
Important findings The results indicate that compared to the LAI, canopy cover and canopy height derived from UAV LiDAR data, GLASS LAI (R2 = 0.29, RMSE= 2.1 m2·m-2), GLCF TCC (R2= 0.47, RMSE= 31%), GFCH (R2= 0.37, RMSE = 5 m) all exhibit large uncertainties and suffer from saturation problems in China’s forested areas, and their accuracy varies significantly across forest types, canopy cover and terrain conditions. In general, the GLASS LAI and GLCF TCC are mainly influenced by forest types and canopy cover, respectively. In contrast, both slope and canopy cover have large influences on the accuracy of GFCH.
Aims Under the current global warming, there are abundant evidence that the phenological events of vegetation in spring have advanced. Advancement of the phenological events in Northern Hemisphere under a gradual warming is considered a process of acclimation rather than an instantaneous feedback. Moreover, the occurrence of spring phenological advancement also varies across ecoregions. Following up on our previous studies, here we aim to determine the temproal scale that temperature has the most influential effect on changes in spring phenology. We further explore how the local spring temperature affects the temperature sensitivity of the spring phenology and the underlying mechanism.
Methods We extracted the dates for spring phenological events by five different methods derived from the GIMMS3g normalized difference vegetation index dataset during 1982-2009. We also employed gridded climatic datasets to calculate the temperature sensitivity of the spring phenology of vegetation, and analyzed the relationship between the temperature sensitivity of phenological events of natural vegetation and environmental variables.
Important findings The spring phenological events of vegetation were mainly regulated by the early spring temperature over the mid- to high-latitude regions in the Northern Hemisphere. Specifically, we found that the maximum temperature in the month of the green-up onset or in the preceding month played the dominant role in affecting the shifts in spring phenology over 54% of the pixels for the study regions; over 91.3% of the pixels displayed phenological shifts by early spring temperature. Interestingly, across the study regions, the standard deviation in interannual temperature, accumulative precipitation and short-wave radiation contrasted in their effects, and differentially or synergistically regulated the temperature sensitivity of spring vegetation phenology.
Aims To analyse the feasibility of space-for-time method in predicting phenology shifts of Plantago asiatica and Taraxacum mongolicum on the Qinghai-Xizang Plateau, as well as revealing the phenological changes of the two herbaceous plants under climate warming.Methods The observed phenological data for Plantago asiatica and Taraxacum mongolicum from 10 sites on the Qinghai-Xizang Plateau during 2002-2011, as well as the meteorological data (i.e., daily mean air temperature) were collected. First, multiple linear regression models were bulit between geographic factors (longitude, latitude and altitude) and phenological events/annual mean temperature at different altitude gradients. Then, the longitude and latitude were kept to be unchanged, and the unary linear regression models between phenological events/annual mean temperature and altitude were built. Finally, the altitude was used as the “bridge” to indicate the relationship between the change of phenological events and the change of annual mean temperature.Important findings The temperature decreased with the increasing altitude (R2 > 0.89, p < 0.05), illustrating that changes of altitude gradients can be used to substitute for changes of annual mean temperature. The change in the simulated phenological events of the two herbaceous plants all showed a strong dependence on the change of altitude (R2 > 0.70, p < 0.05), which contributed the most among the geographic factors. Strong dependences were observed between the simulated phenological events and the simulated annual mean temperature (R2 > 0.93, p < 0.05), showing that phenological events could be predicted by the annual mean temperature with the space-for- time method. For Plantago asiatica, the first leaf date (FLD) and the first flowering date (FFD) occurred earlier with increasing annual mean temperature as 5.1 and 5.4 days per ℃, respectively, while the common leaf coloring date (LCD) occurred later as 4.8 days per ℃. The FLD and FFD of Taraxacum mongolicum advanced by 6.5 days and 7.8 days per ℃ of increase in the mean annual temperature while the LCD delayed by 6.7 days per ℃.
Spectral diversity is a biodiversity dimension based on electromagnetic radiation spectrum reflected by plant, showing the variation of spectral reflective ratio in different bands among interspecific and intraspecific plant individuals. Spectral diversity has become an important technique for plant diversity monitoring and assessment since the differences of spectral reflectance can comprehensively indicate the differences of biochemical components and morphological and structural characteristics among plants. Here we introduce the concept of spectral diversity and its ecological significance, compare the technical advantages and disadvantages among multiple sources and platforms producing spectral data, summarize the monitoring and evaluation methodologies of plant diversity based on the applications of spectral diversity, and discuss the ability of spectral diversity to integrate different biodiversity dimensions and the prospect of the application of spectral diversity in biodiversity research. Spectral diversity will serve the monitoring and assessment of plant diversity at multiple spatial scales, especially combined with near-ground remote sensing based on unmanned aerial vehicle technology, can achieve fine-scale monitoring and assessment of plant diversity, and thus has broad application prospects in biodiversity conservation and management.
Aims With increasing anthropogenic activities in coastal areas, human disturbances have been identified as major causes of the decline of coastal mangroves and undemine the sustainable development. Monitoring the spatial-temporal dynamics of typical human activities in mangrove ecosystems and adjacent areas is critical in conservation and restoration of local mangrove ecosystems.
Methods We proposed an object-oriented machine learning method based on seasonal water fluctuations, using Landsat satellite imagery on Google Earth Engine platform. Inundation frequency was incorporated as a classification feature to obtain the spatial pattern of aquaculture ponds, which is concerned as the key driver of degradation and losses of mangroves. We revealed the dynamics of aquaculture ponds at a 30 m-resolution between 1990 and 2020 in China’s coastal regions with mangrove community detected, including Guangdong, Fujian, Zhejiang, Taiwan, Guangxi, and Hainan.
Important findings The total area of coastal aquaculture ponds in 1990 was about 2 963 km2, which increased to 5 200 km2 in 2000 and 5 377 km2 in 2010, and then decreased to 4 805 km2 in 2020. The maximum appeared between 2010 and 2020, but there was a significant regional variation in the changing pattern and peaking time of coastal aquaculture ponds. Coastal aquaculture ponds were mainly concentrated in the region of 21°-24° N (Guangdong and Guangxi). The spatial pattern of mangroves was shown as a staggered arrangement to that of aquaculture ponds. Our results also indicate a symbiotic relationship between aquaculture ponds and mangroves at latitude 21°-22° N, where a large number of mangroves grow along the edges of aquaculture ponds. This special distribution of mangroves and aquaculture ponds leads to a high level of interconnections between these two ecosystems, which can be recognized as the typical areas in exploring the impacts of human activities on mangrove ecosystems. The conversion of mangroves to aquaculture ponds was the primary cause of mangrove loss, which led to the extreme fragmentation and aggregation of mangrove patches in different areas. Our research on the spatial-temporal pattern of coastal aquaculture ponds provides an accurate dataset to assess the impacts of increasing human activities on mangrove ecosystems, and may contribute to the identification of priority restoration area.

 Ecological remote sensing and application
